Russia: Post-war Potential Growth
Russian potential growth potential will be reduced to 0.0-0.5% in the next decade.
The largest headwind comes from declining capital productivity which comes from increasingly large share of construction in investment, but also due to foreign corporate divestment.
Baseline approach: Production function accounting
We use production function-based growth accounting for long-term baseline growth projections. It is implemented in 4 steps:
Gather data on 5 inputs - employment level, average hours worked, labour quality/human capital, fixed capital and aggregate productivity/capital efficiency - and the level of output.
Filter the series to remove cyclical component - so that changes in capacity utilization during booms and recessions do not affect our estimates.
Forecast the trajectories of inputs by extrapolating trends and cross-country benchmarks.
Estimate a production function based on the historical proportions of inputs to outputs and apply estimated coefficients to the extrapolated trajectories of inputs.
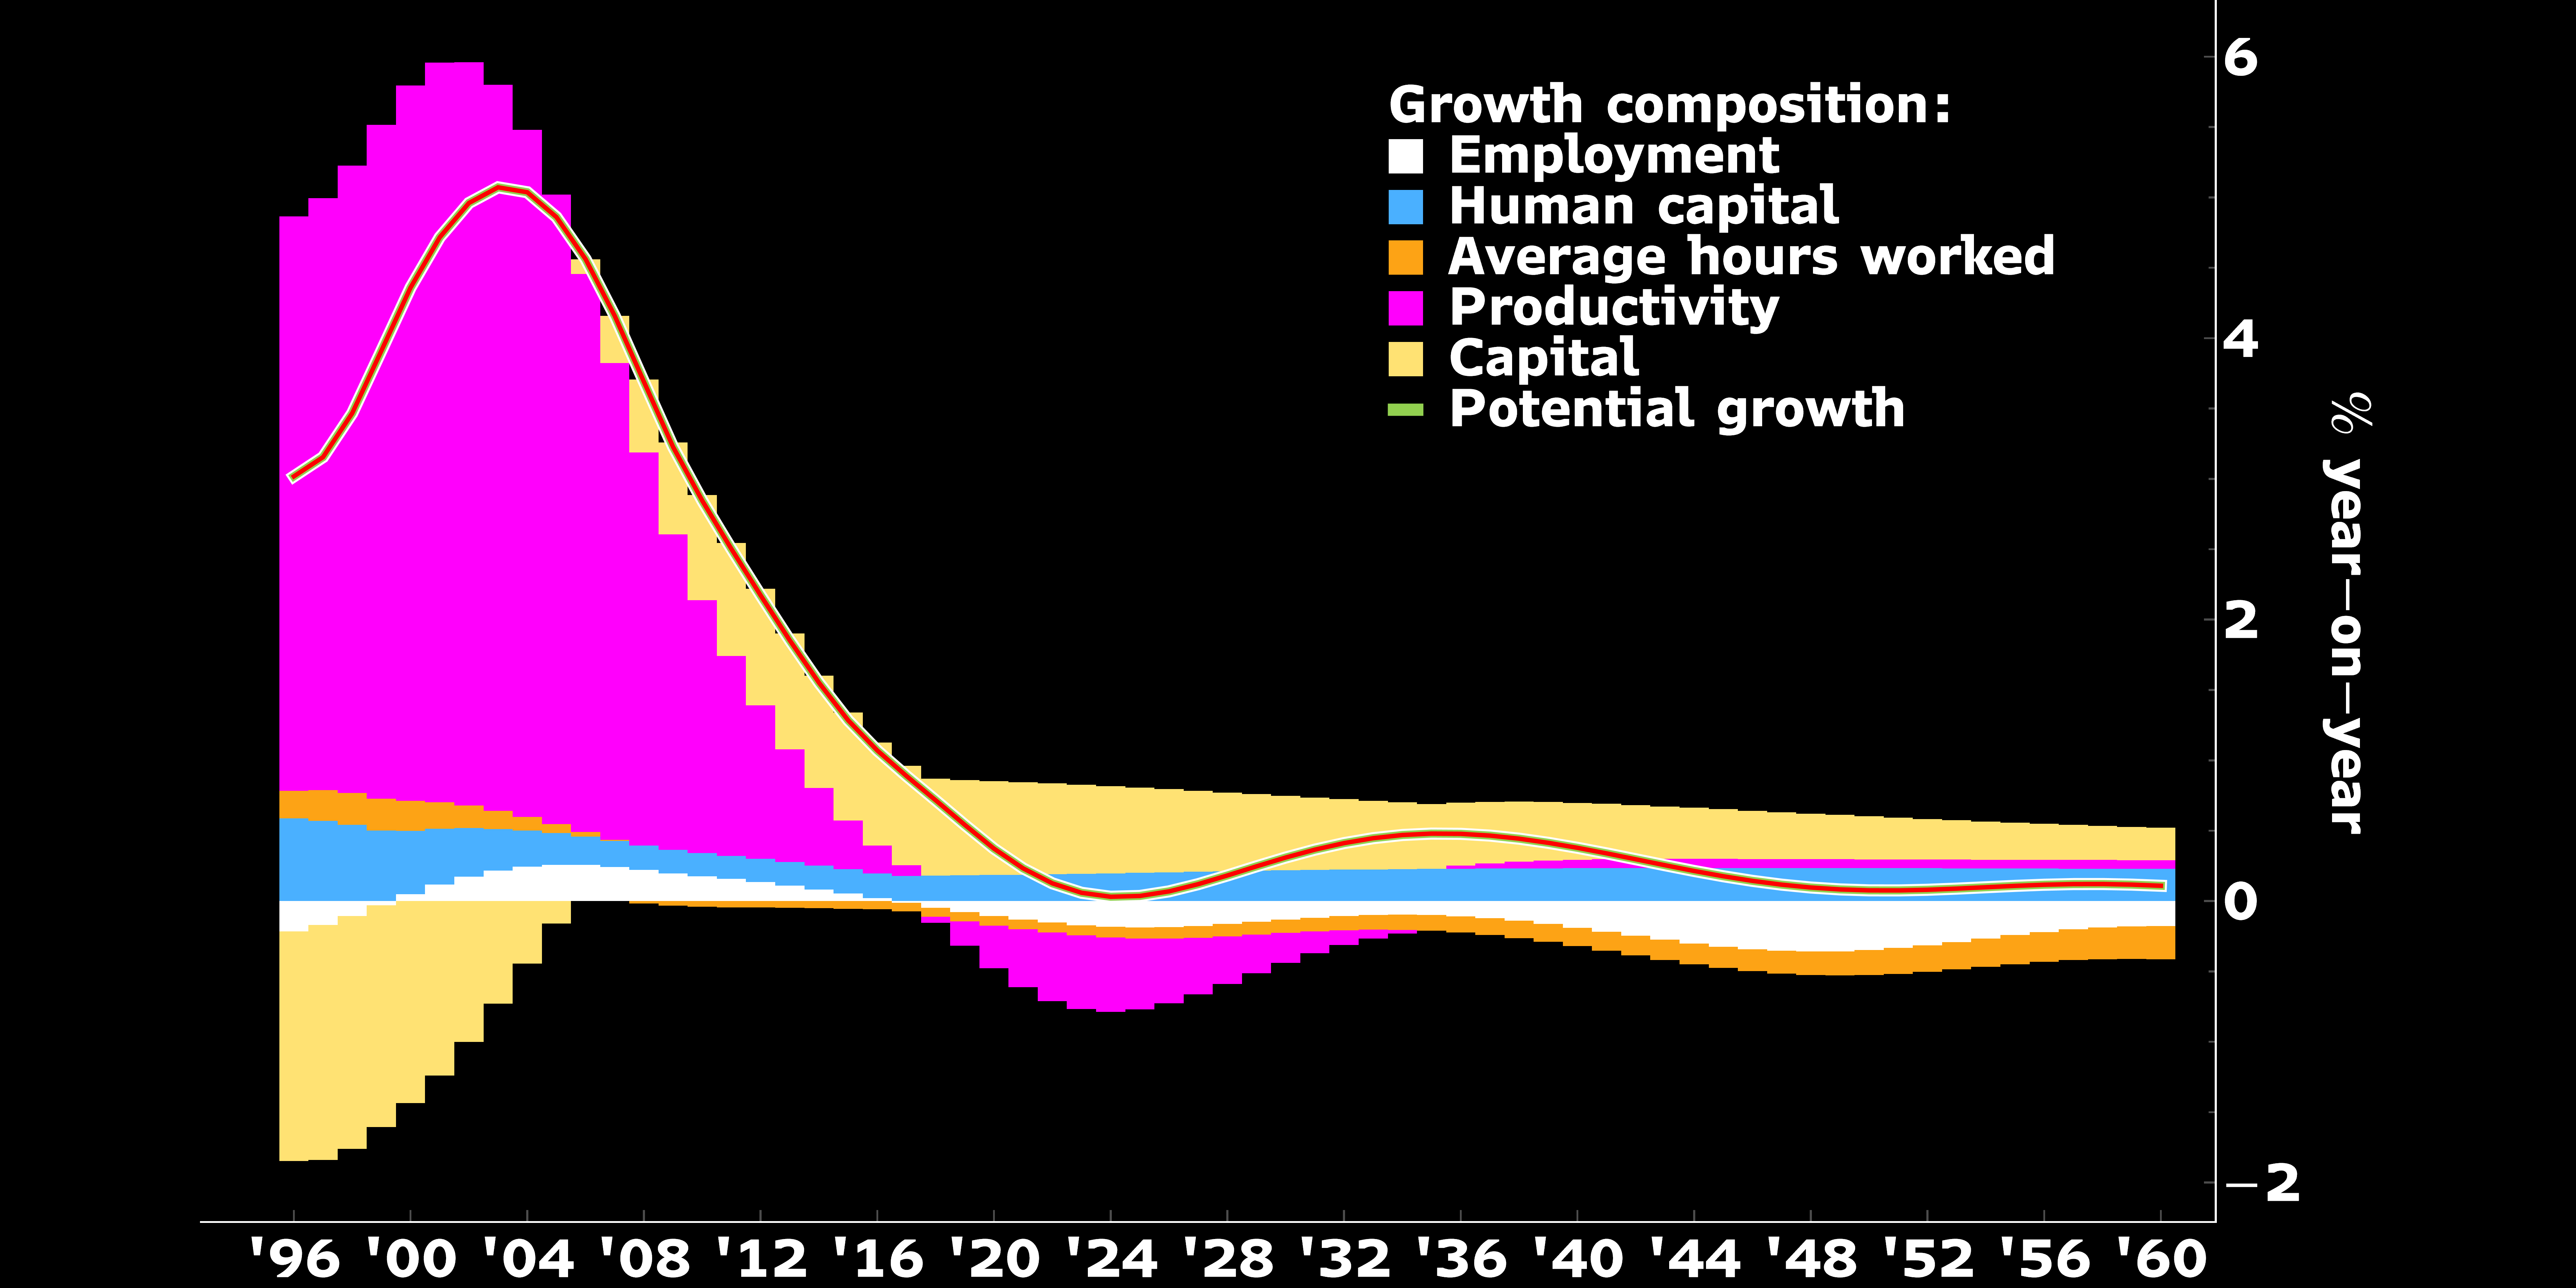
| Year | Employment, pp | Human capital, pp | Avg hours, pp | Productivity, pp | Capital, pp | Potential growth, % |
|---|---|---|---|---|---|---|
| 2013 | 0.11 | 0.17 | -0.05 | 0.8 | 0.82 | 1.85 |
| 2014 | 0.08 | 0.17 | -0.05 | 0.55 | 0.8 | 1.55 |
| 2015 | 0.05 | 0.17 | -0.05 | 0.35 | 0.77 | 1.28 |
| 2016 | 0.02 | 0.18 | -0.06 | 0.2 | 0.73 | 1.07 |
| 2017 | -0.01 | 0.18 | -0.06 | 0.08 | 0.71 | 0.89 |
| 2018 | -0.05 | 0.18 | -0.06 | -0.04 | 0.69 | 0.72 |
| 2019 | -0.08 | 0.18 | -0.07 | -0.17 | 0.68 | 0.54 |
| 2020 | -0.11 | 0.18 | -0.07 | -0.3 | 0.67 | 0.37 |
| 2021 | -0.13 | 0.19 | -0.07 | -0.41 | 0.66 | 0.23 |
| 2022 | -0.15 | 0.19 | -0.07 | -0.49 | 0.65 | 0.13 |
| 2023 | -0.17 | 0.19 | -0.07 | -0.52 | 0.63 | 0.06 |
| 2024 | -0.18 | 0.2 | -0.08 | -0.53 | 0.62 | 0.03 |
| 2025 | -0.19 | 0.2 | -0.08 | -0.5 | 0.61 | 0.04 |
| 2026 | -0.18 | 0.2 | -0.08 | -0.46 | 0.59 | 0.07 |
| 2027 | -0.18 | 0.21 | -0.08 | -0.4 | 0.57 | 0.12 |
| 2028 | -0.16 | 0.21 | -0.09 | -0.34 | 0.56 | 0.18 |
| 2029 | -0.15 | 0.22 | -0.09 | -0.27 | 0.54 | 0.25 |
| 2030 | -0.13 | 0.22 | -0.09 | -0.21 | 0.53 | 0.31 |
That we estimate the we take the level of potential output to be:
\[ Y_t = K_t L_t \]
where \(K\) and \(L\) are respectively the effective labour and capital contributions to output.
\[ L_t = E_t^{\alpha_1} A_t^{\alpha_2} H_t^{\alpha_3} \]
where \(E_t\) is employemnt, \(A_t\) - is human capital, \(H_t\) is hours worked.
\[ K_t = C_t^{\alpha_4} P_t^{\alpha_5} \]
where \(C_t\) is the stock of capital, \(P_t\) - is productivity.
Inputs: data sources and trends
We rely on three data sources: Penn World Table, UN Population Division and Rosstat.
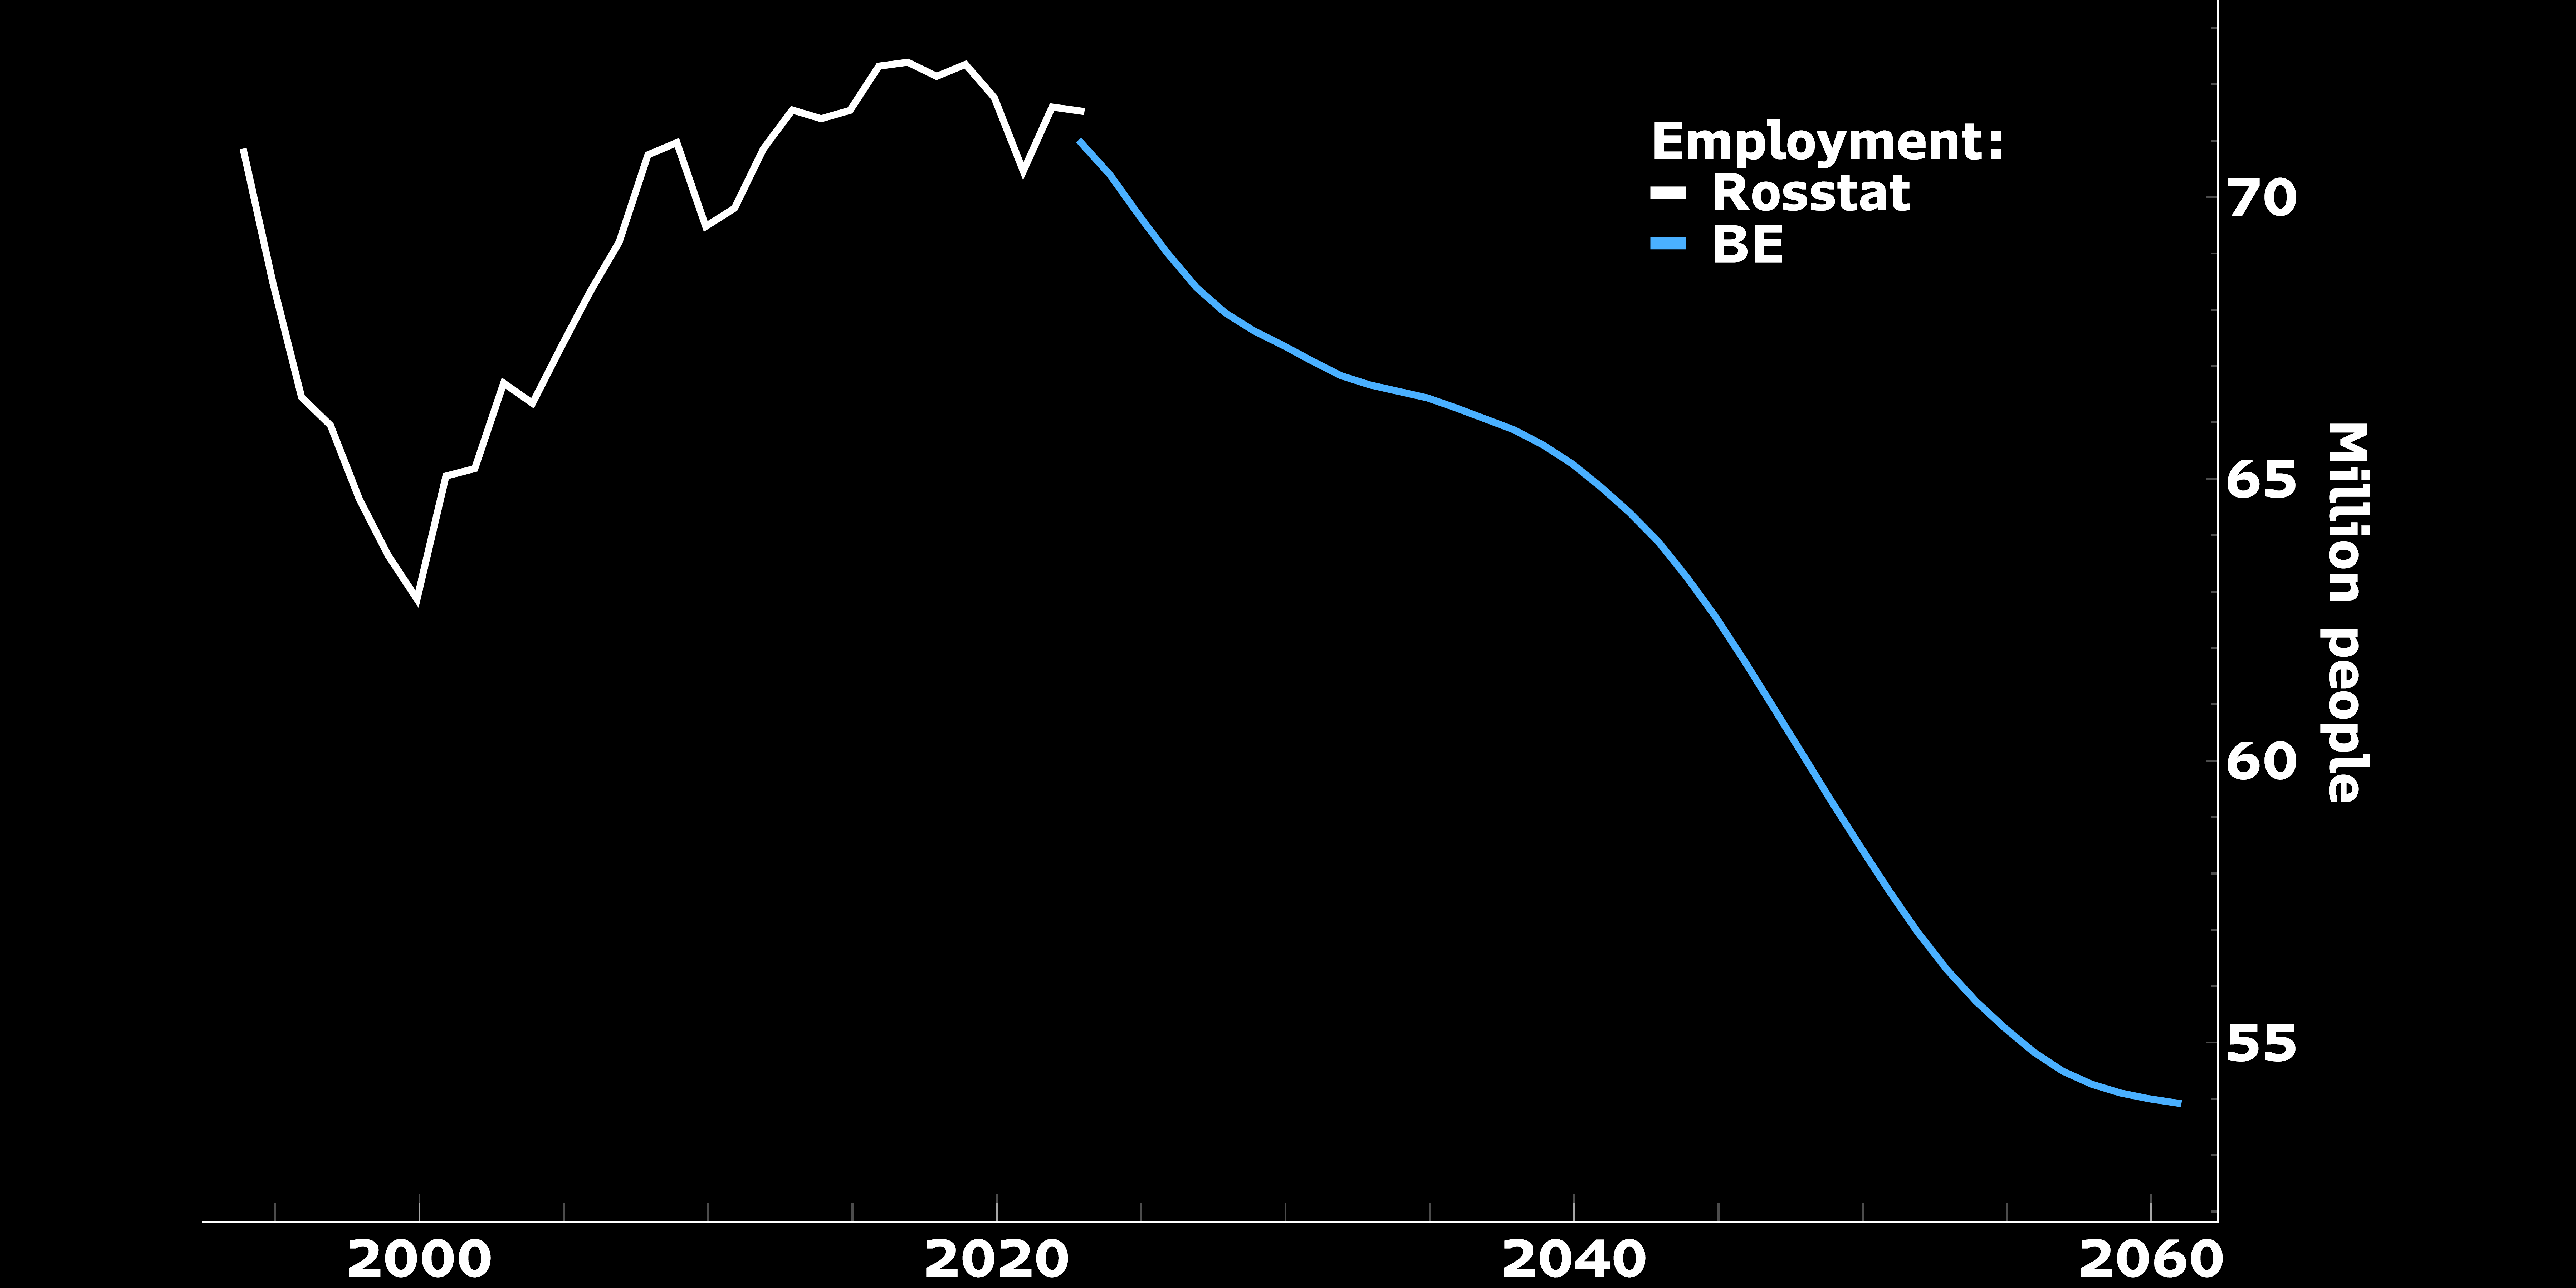
Employment
We combine Rosstat’s data on population and age structure with UN PD’s forecast of the population age structure. We essentially assume that employment ratios in 5-year age groups remain unchanged, so employment changes are affected by the overall size of population and the age structure.
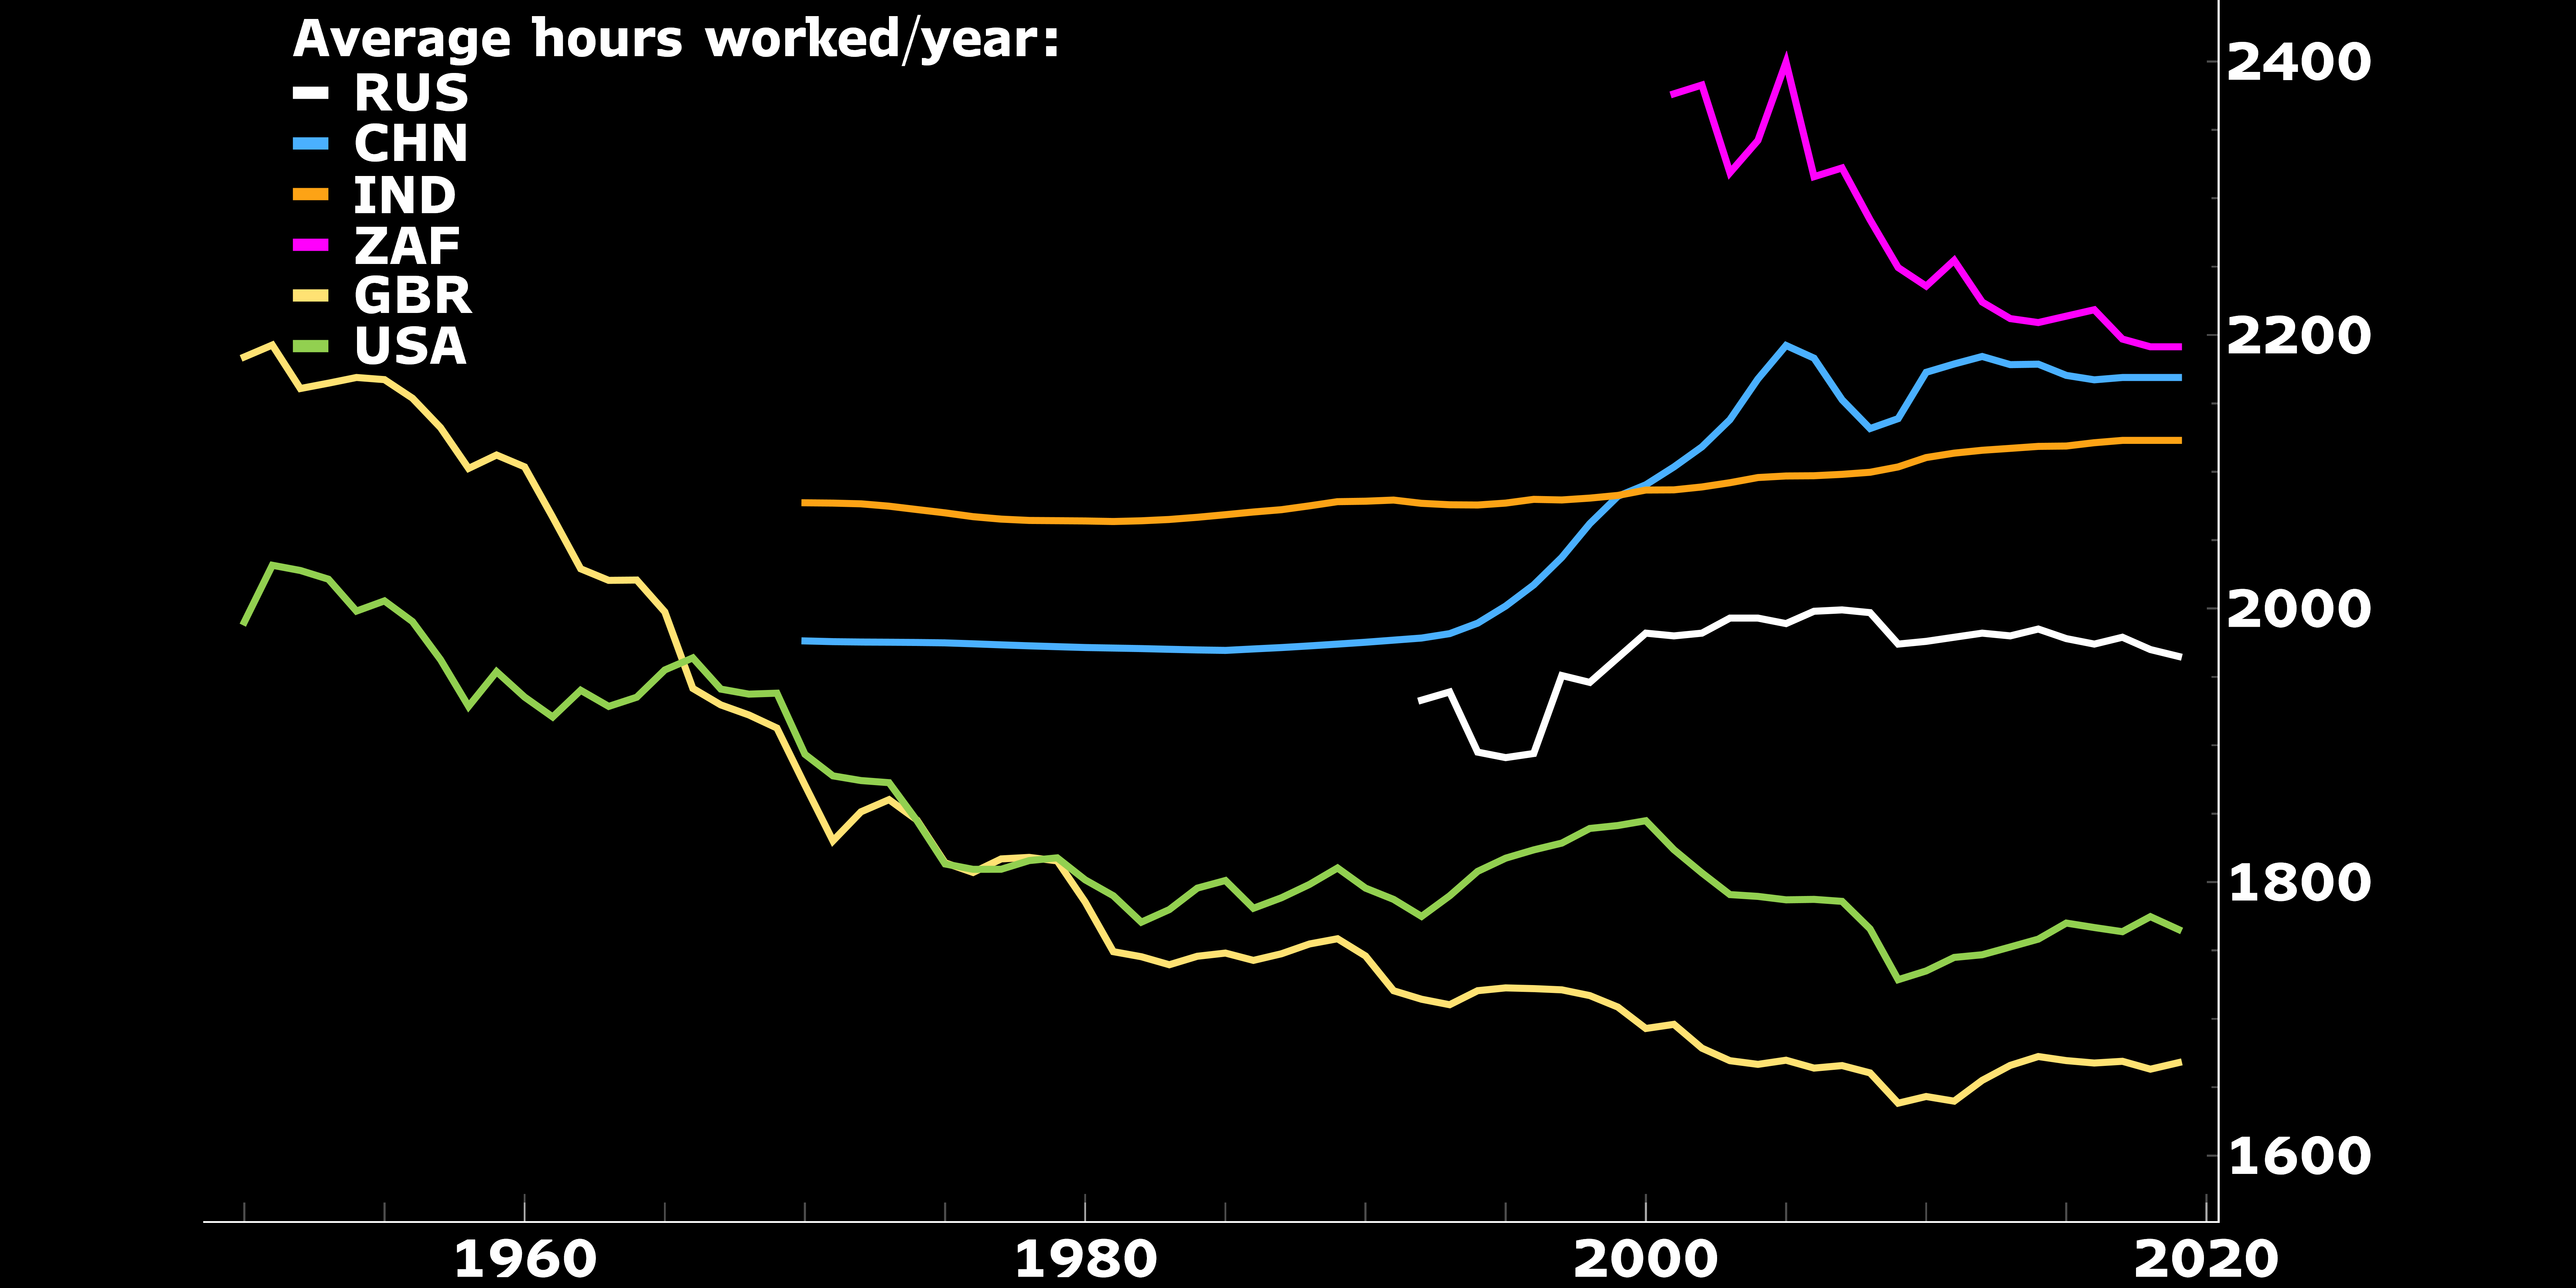
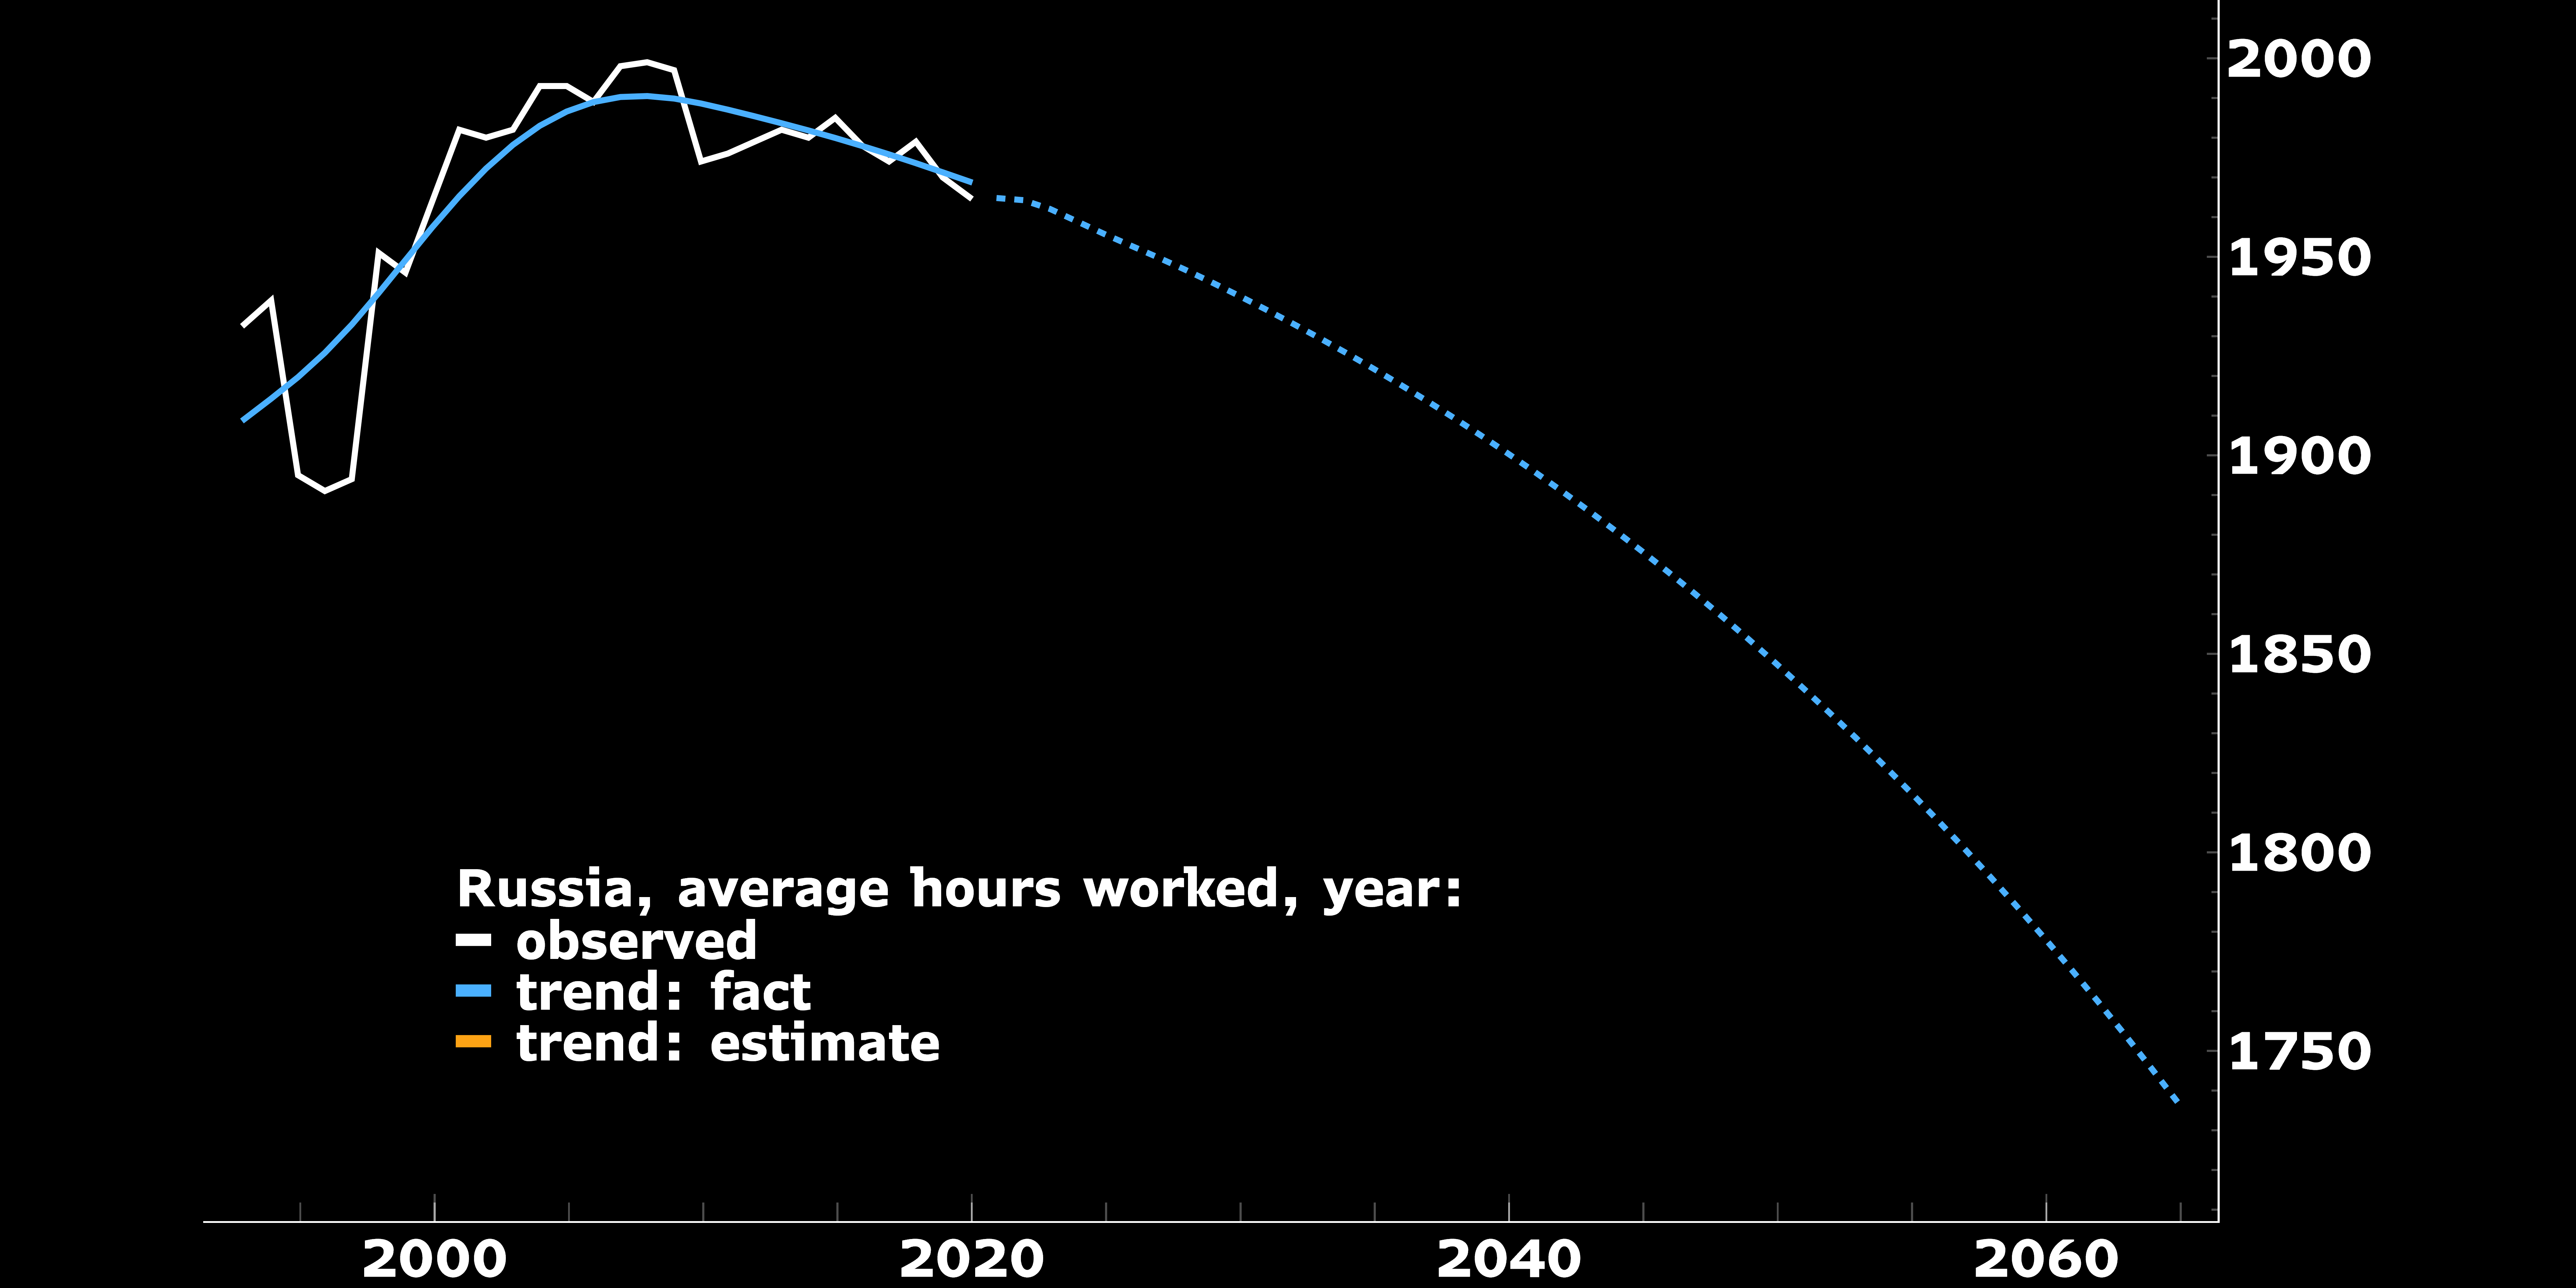
Hours Worked
We rely on Penn World Table data on the hours worked. Our projections imply that over the next 40 years average hours in Russia decline to around 1.8k per year, which where they were in UK and US in the 1980s.
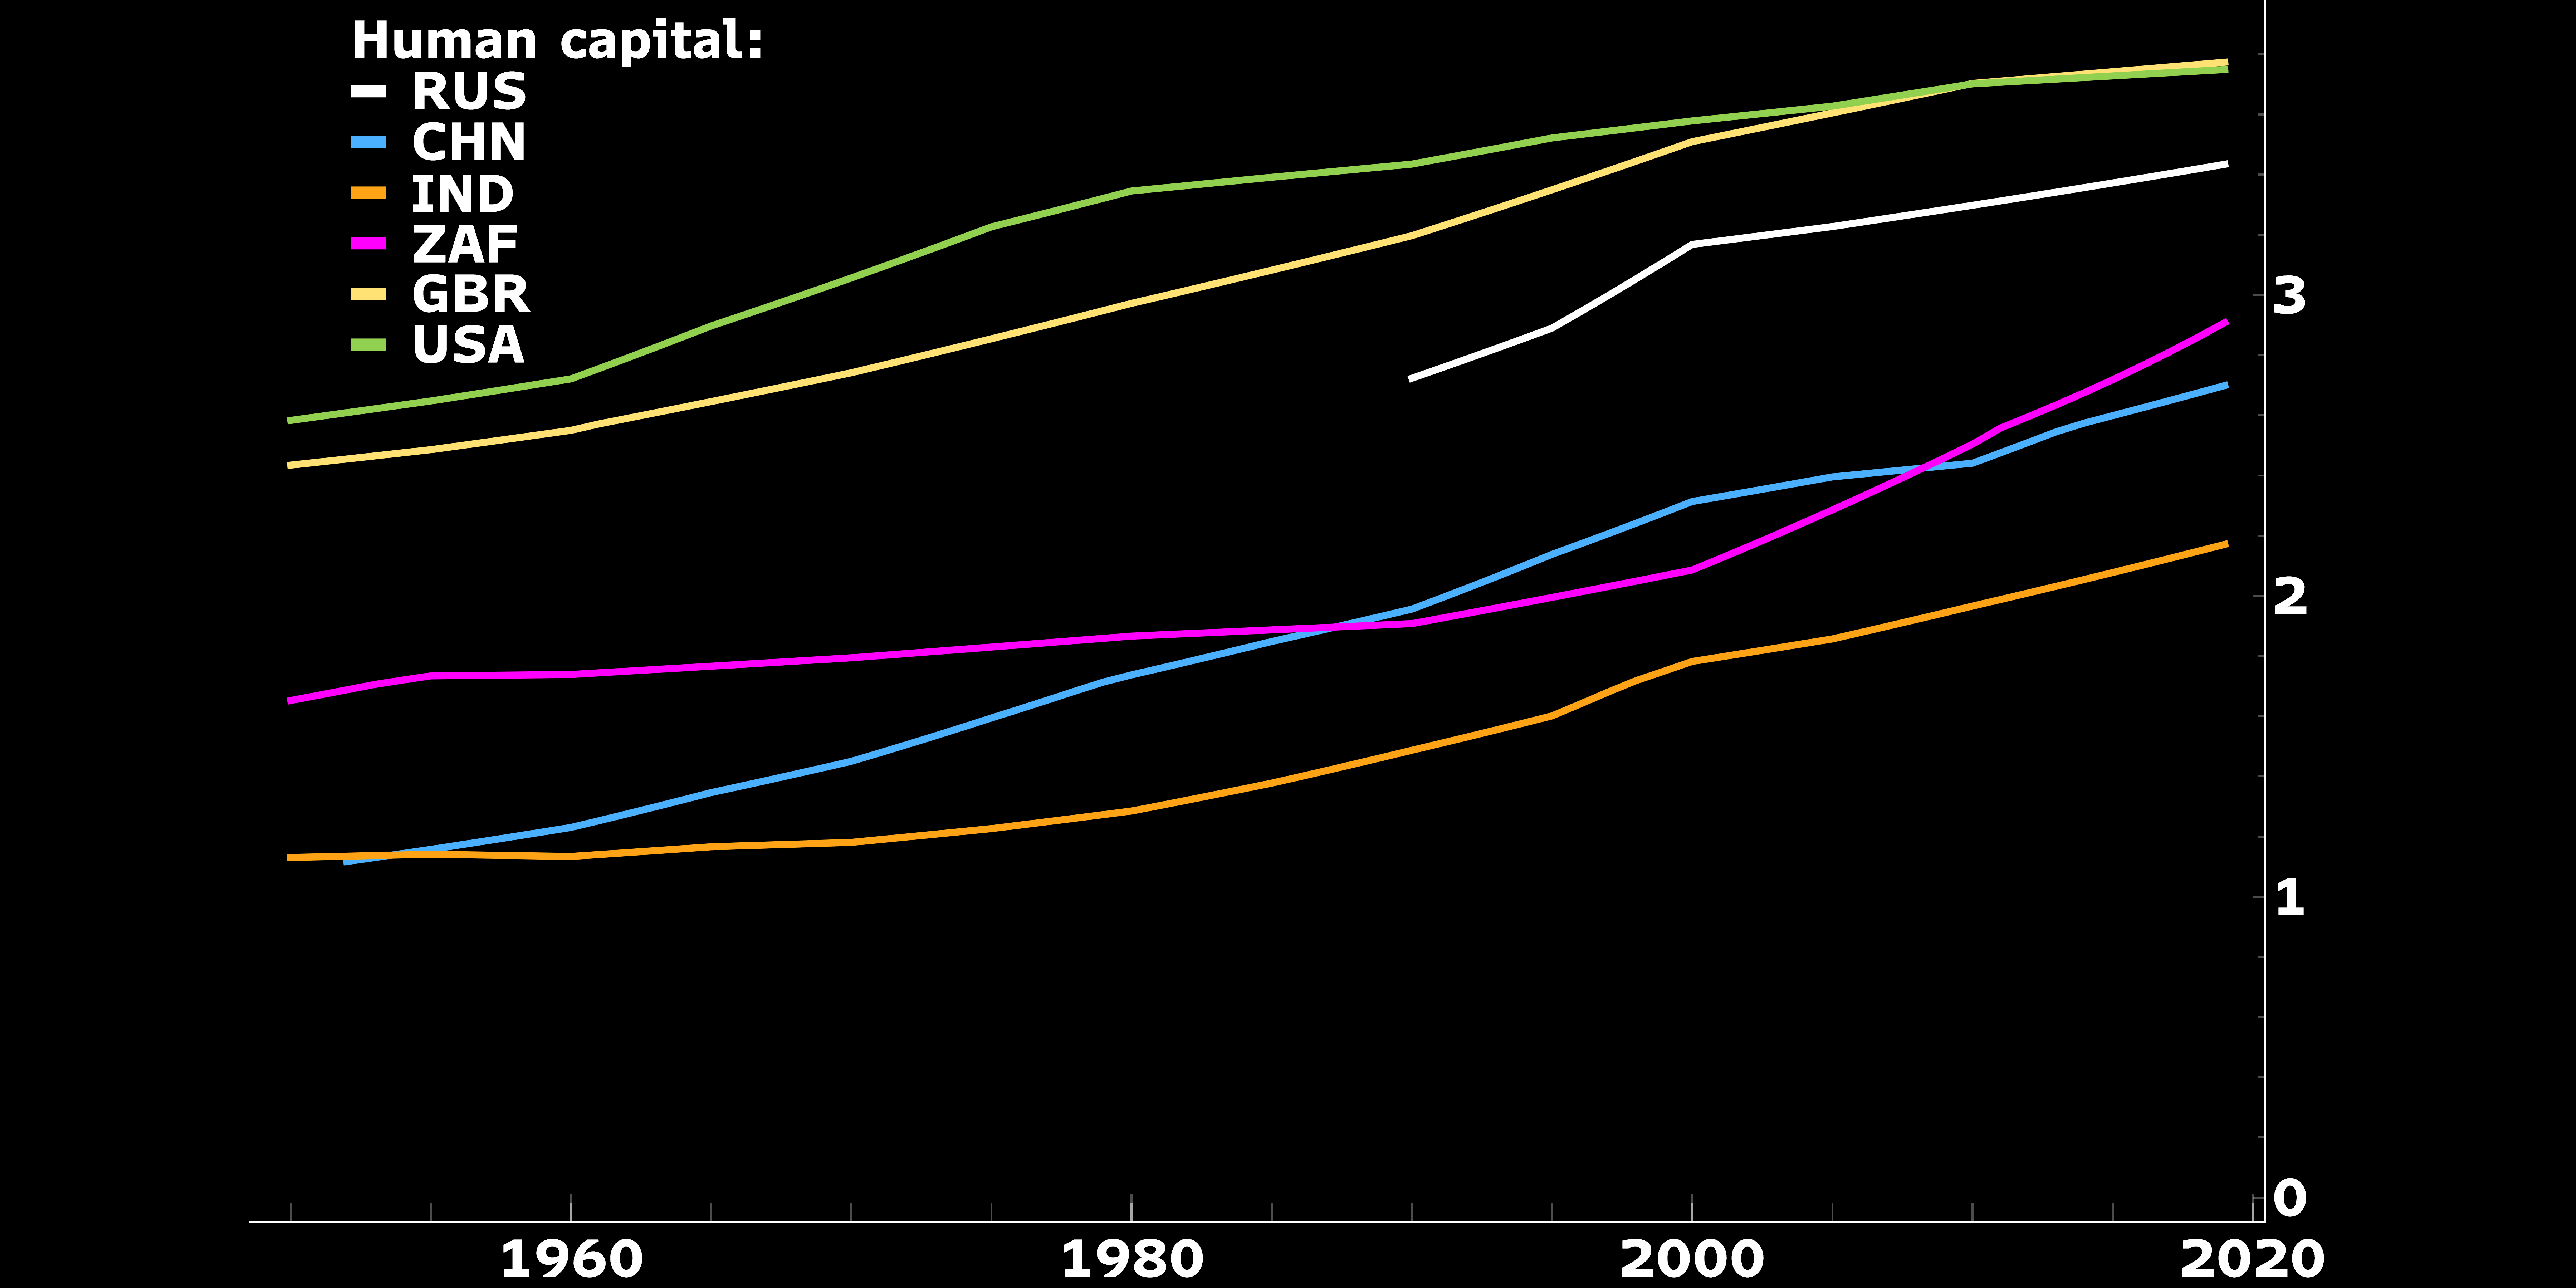
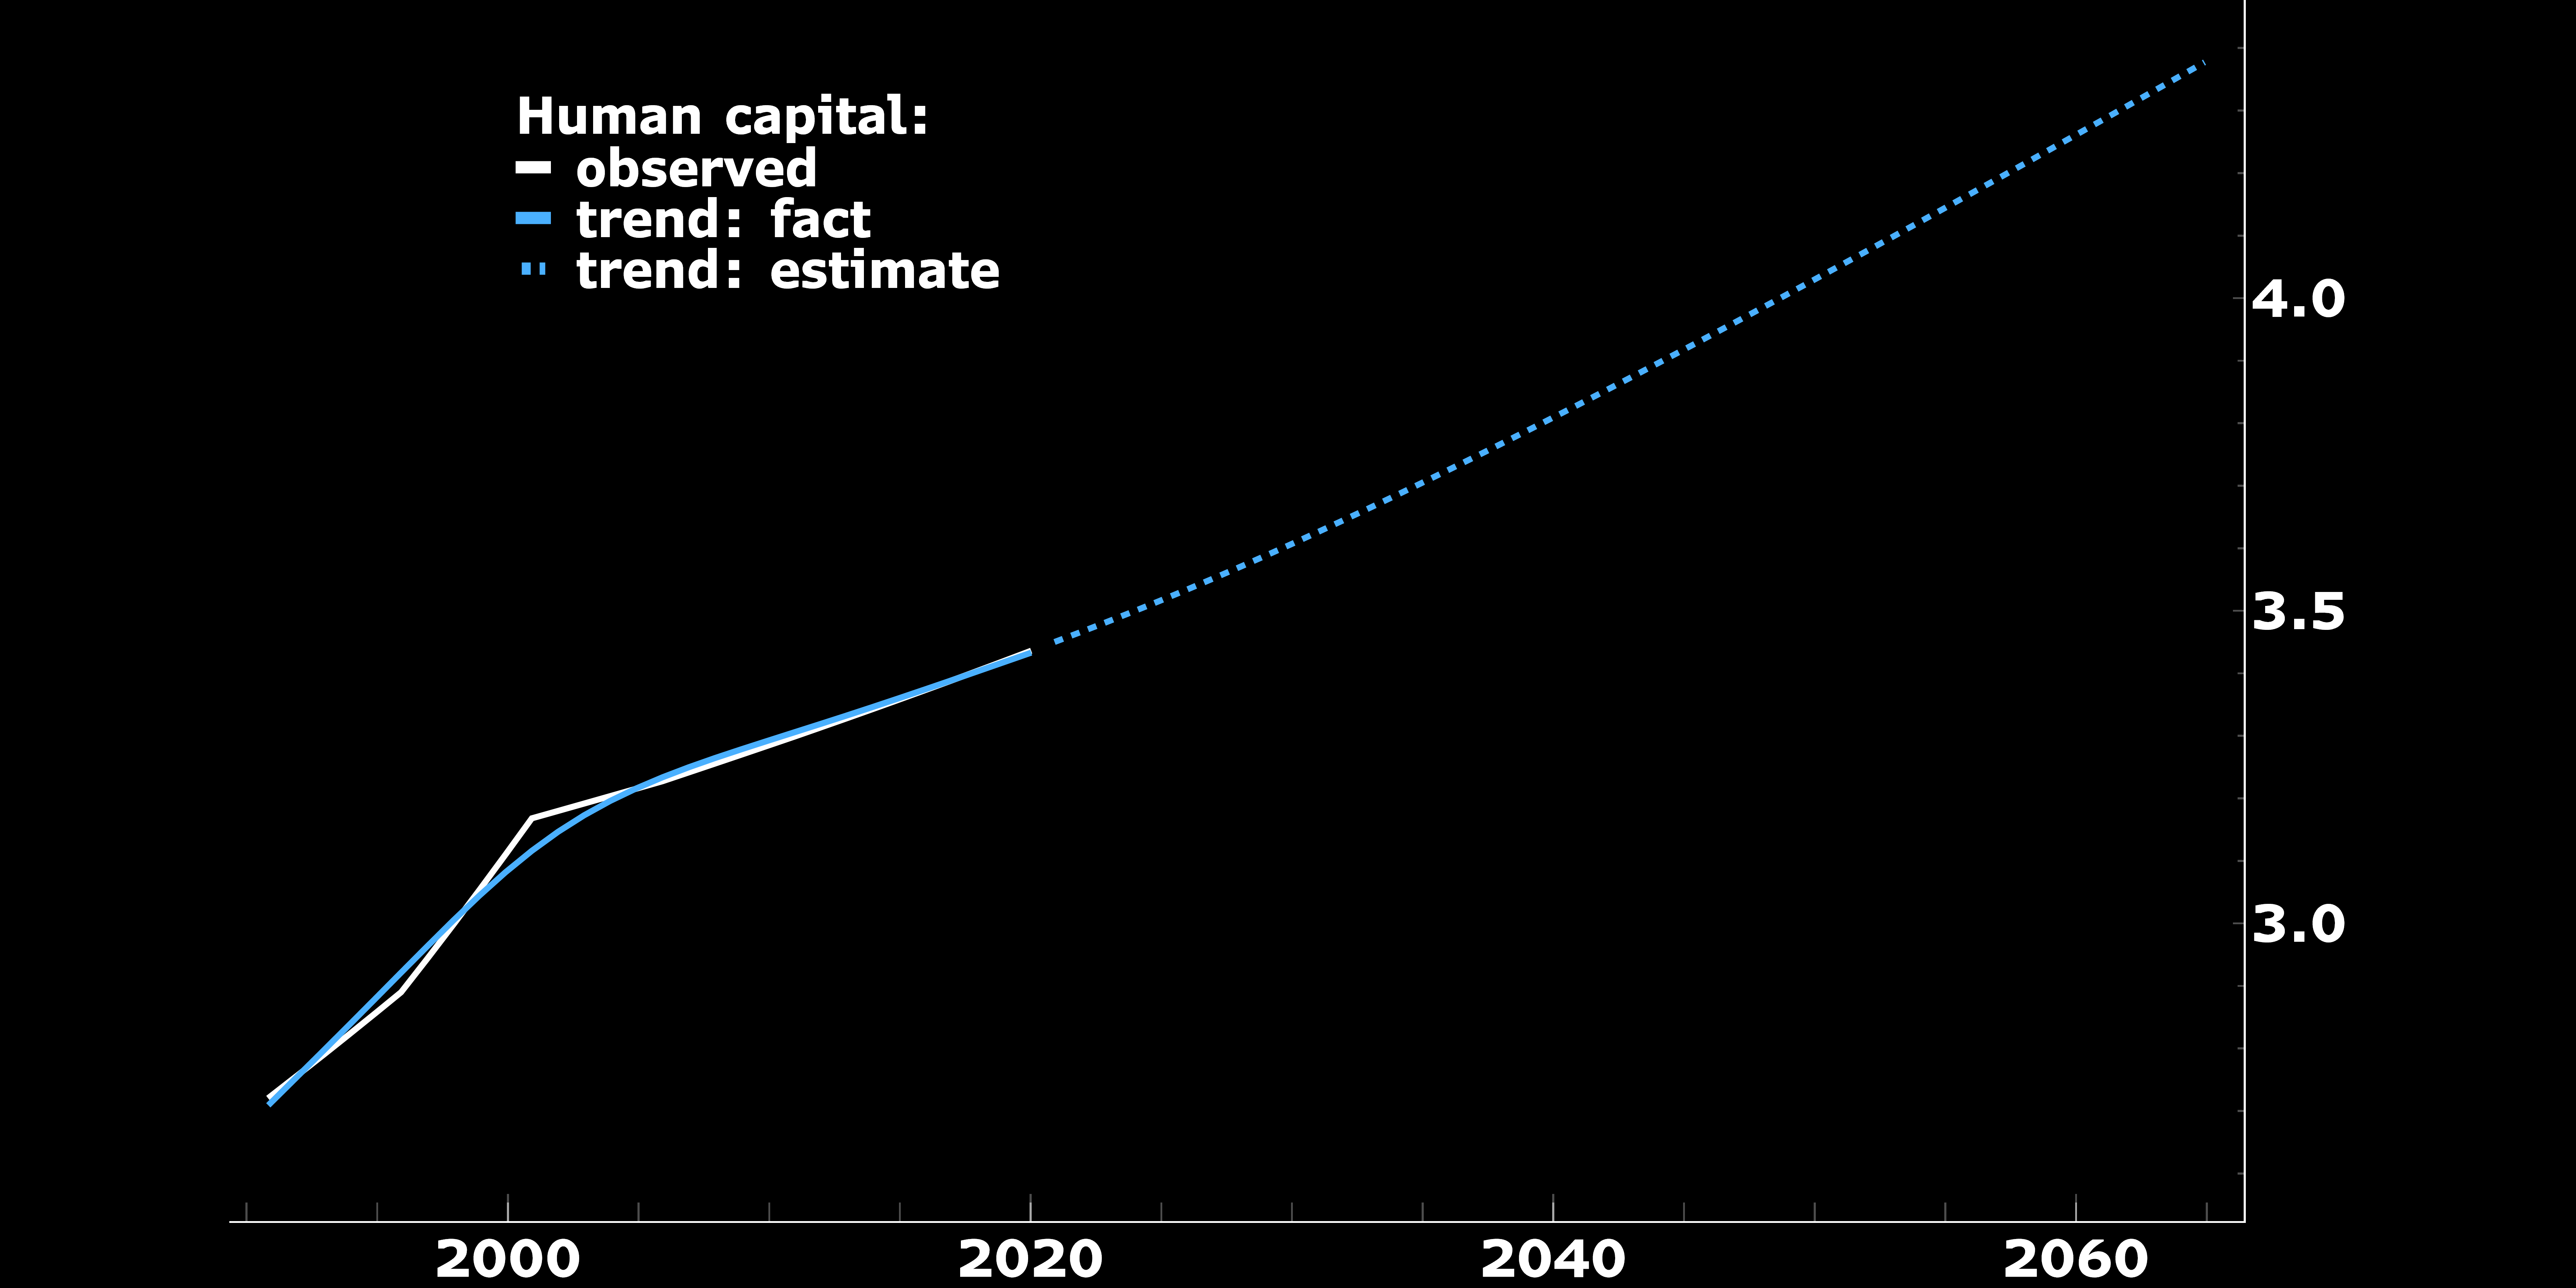
Human capital
We rely on Penn World Table for an estimate of the human capital per employee. PWT estimates it based on average years of schooling of the labour force. We extrapolate the current upward trend in this index.
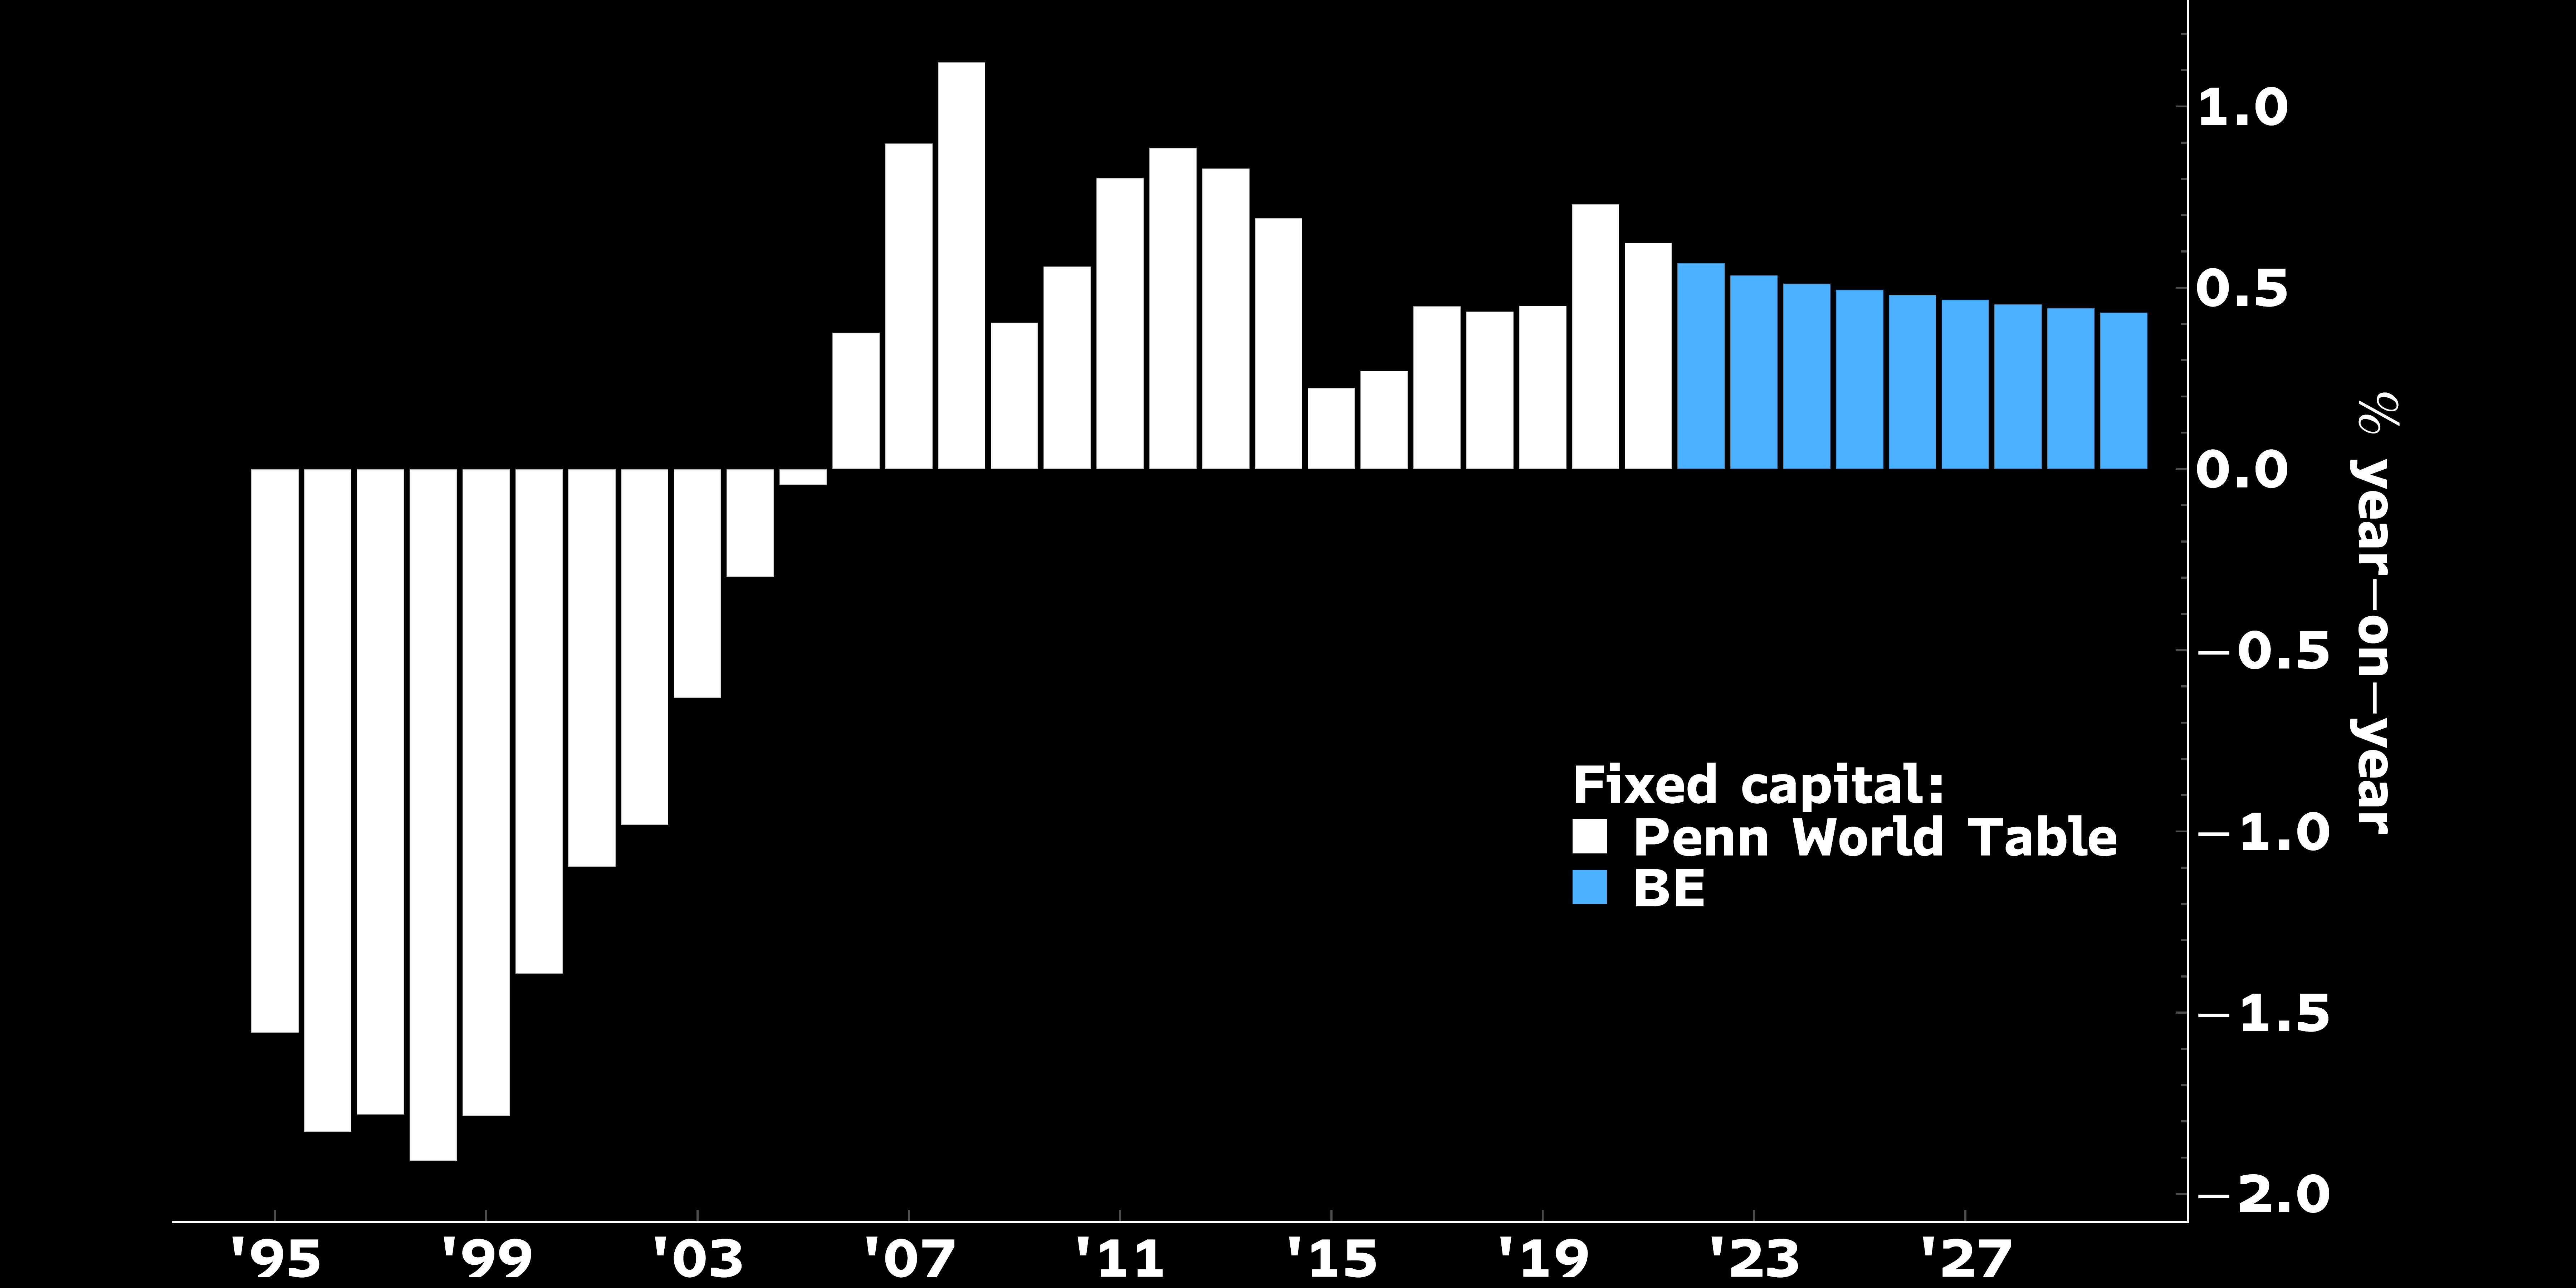
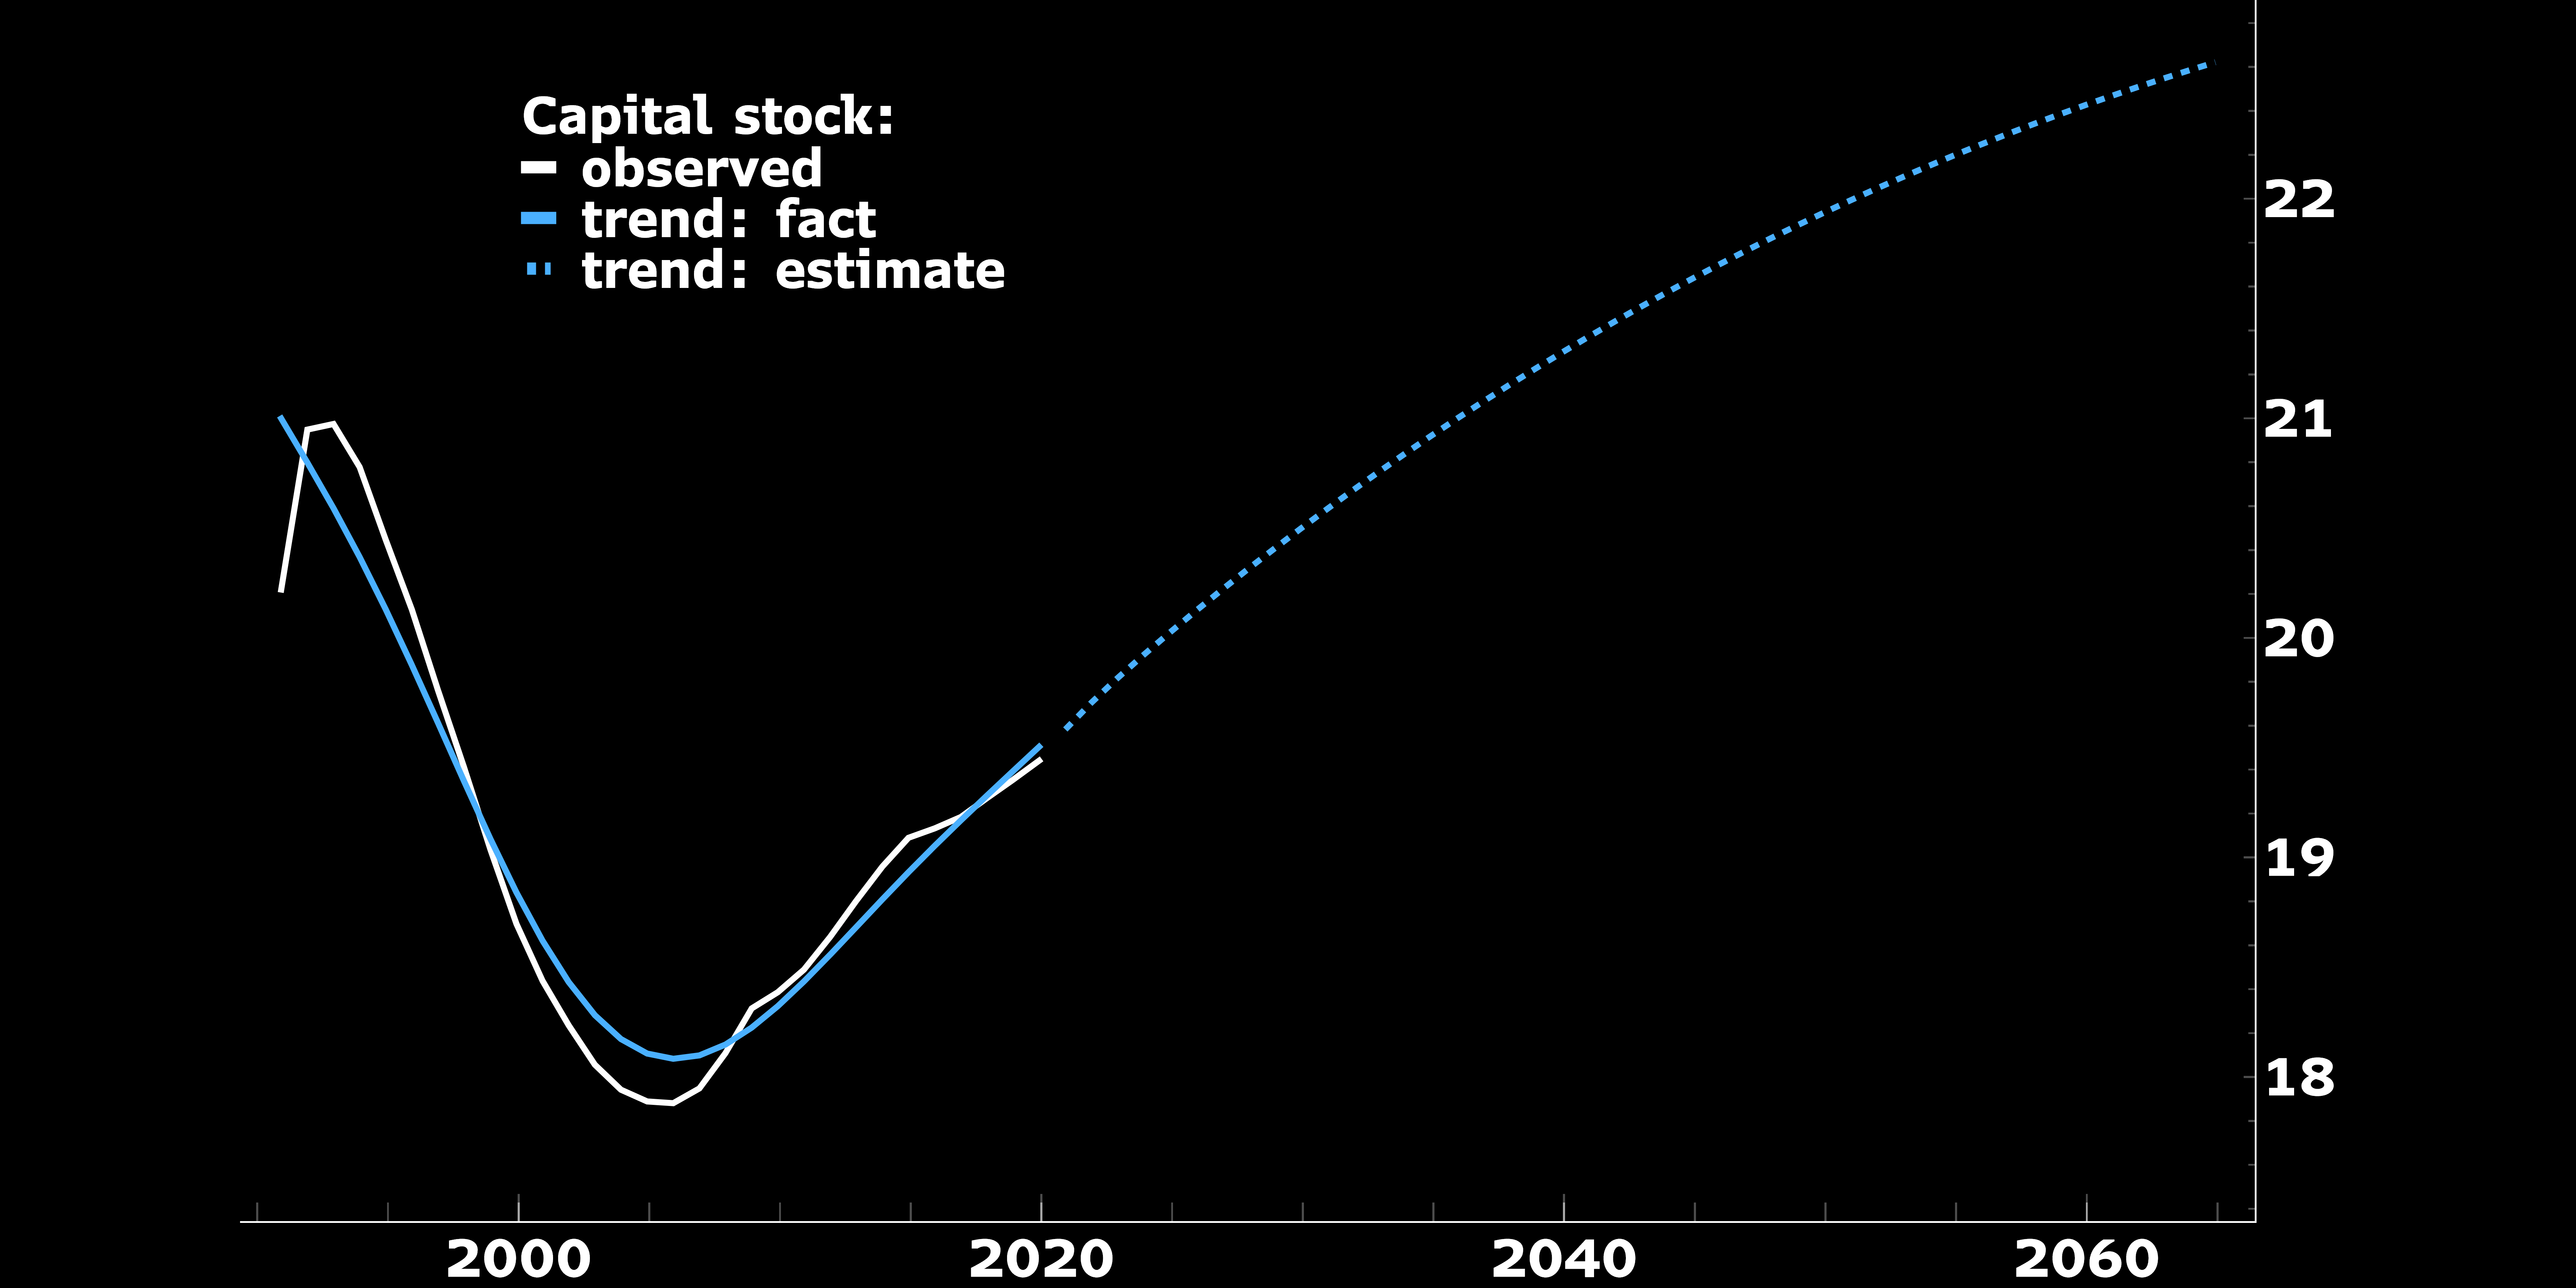
Capital stock
We use the Penn World Table estimate of the stock of capital. It matches estimates from Rosstat if we apply investment and depreciation rates to their estimates of nominal capital stock. The outlook for growth of the capital stock such that it expands a bit faster than historically. This is driven by our assumption of the focus on replenishing the stocks of defence equipment and residential construction.
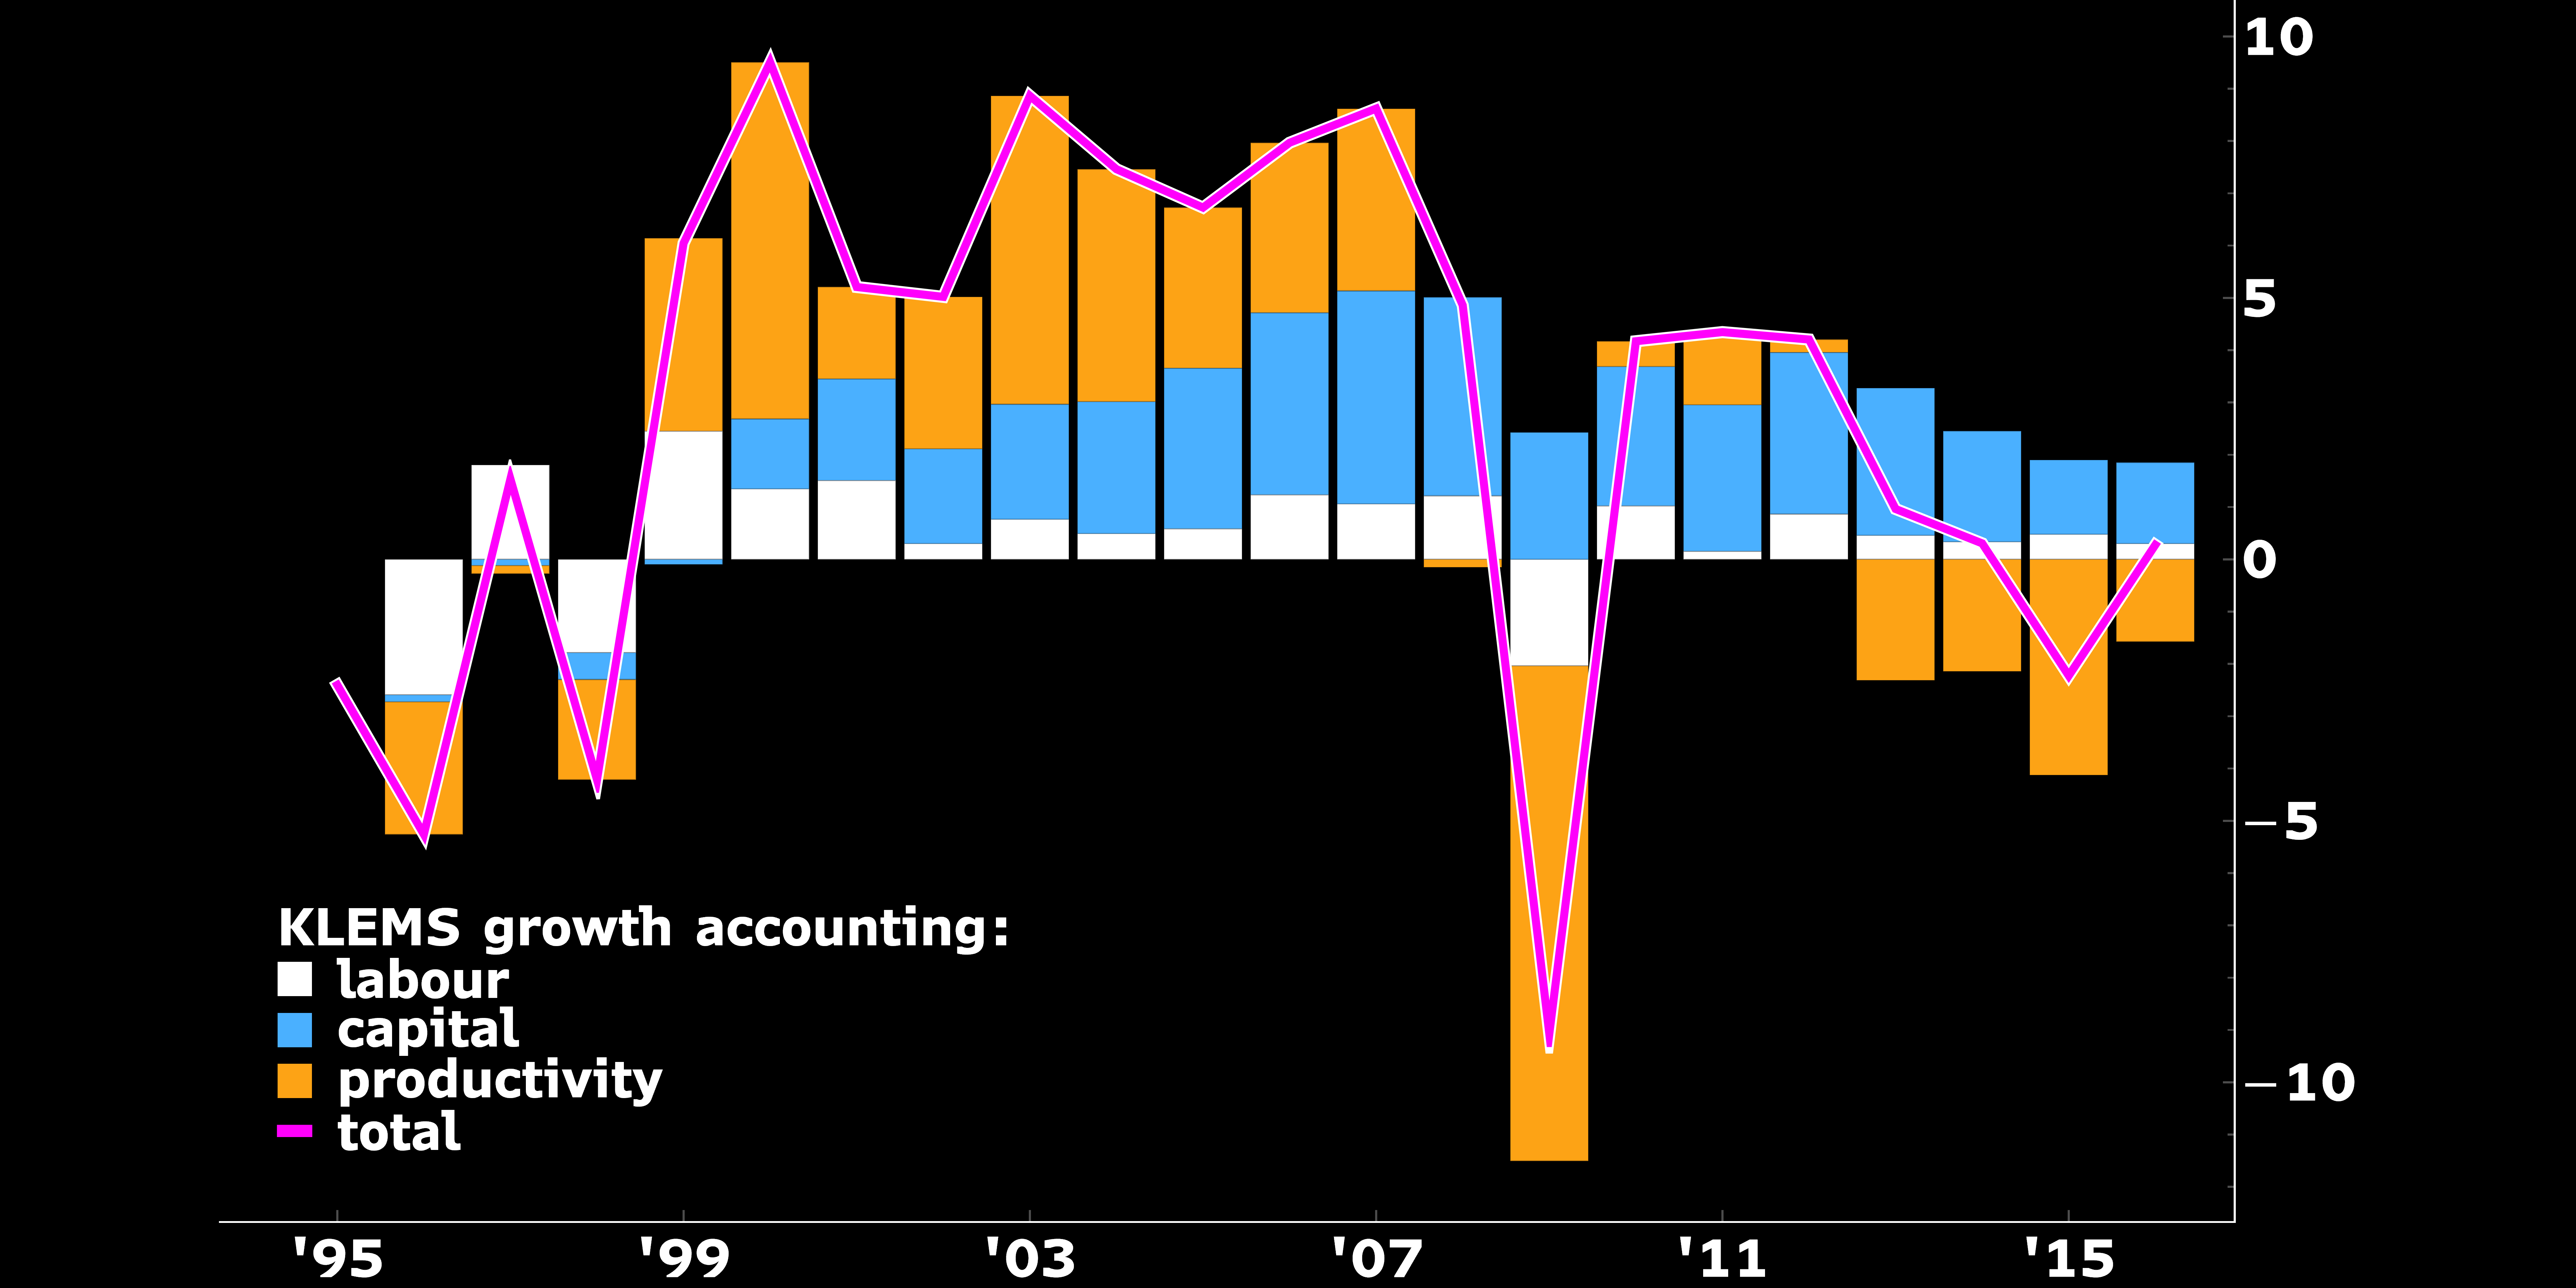
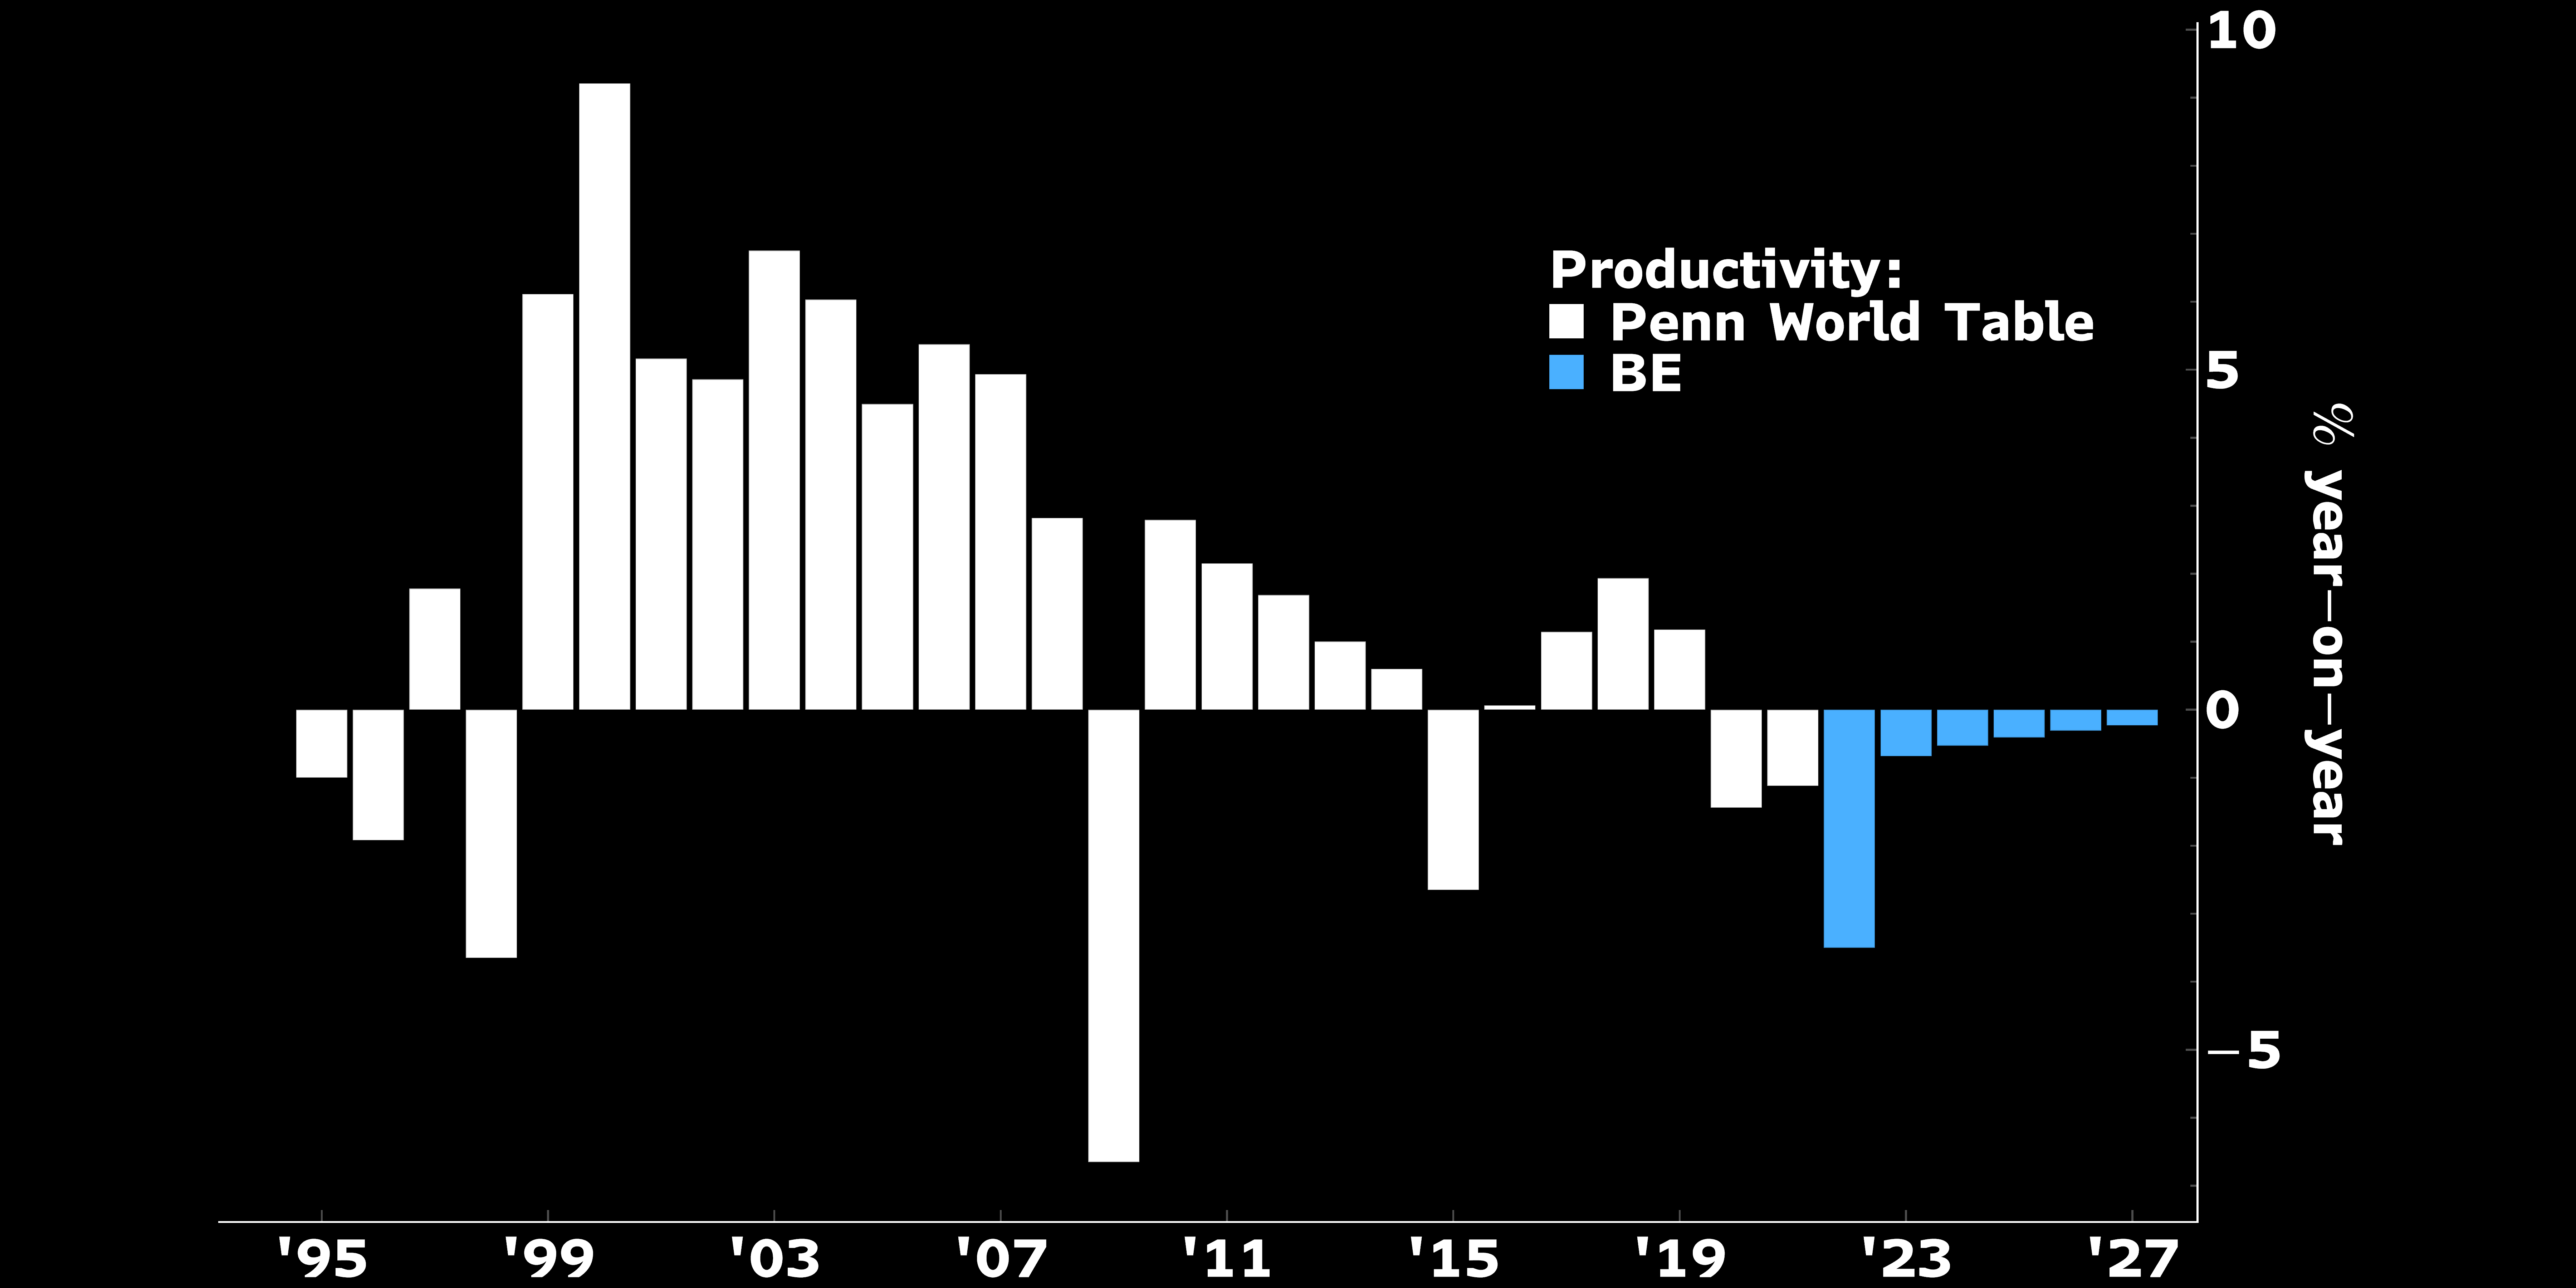
Productivitiy
Again, capital efficiency is from the Penn World Tables. Because it is largely unobservable we benchmark PWT estimates with another growth accounting framework, KLEMS. The estimates are similar.
The intuition behind our projections is that despite growth in the quantity of capital stock its quality will deteriorate. New capital mix will have increasingly large share of buidlings (residential and commercial), defence equipment etc., which have lower ability to increase output than machinery and equipment.